3D binding pocket protein structure similarity virtual screening
|
 |
|
|
|
|
|
|
|
|
|
|
|
|
Contents
2. Scores of 3Dclick 3. Output of 3Dclick 4. Mouse controls for 3Dclick visualization 5. Running time 6. Browser compatibility 1. Query structure and ligandQuery Structure
The structure 1zao, chain A Ligand Name
The name of the query ligand is ATP Ligand Position
The position of the query ligand is 286 The position of the query ligand is 512C Ligand Chain
The chain of the ligand is A Choosing databaseCurrently, users can run virtual screening over structural databases of
1kj9A 1zaoA AF-Q5VST9-F32 AF-Q5VST9-F30 AF-Q9BVS4-F1 AF-Q9Y6M4-F1 AF-O14730-F1 Email addressInput examples
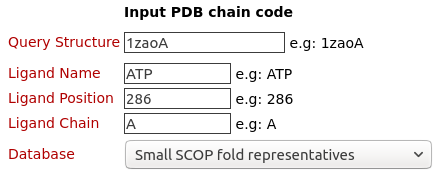
The binding pocket/site of the ligand ATP (Adenosine triphosphate) on the structure of A.fulgidus Rio2 Kinase (PDB code: 1zaoA) is used for structure similarity virtual screening by 3Dclick on the database of Small SCOP fold representatives of 252 protein chains.
Please click here to look at the output of this query example.
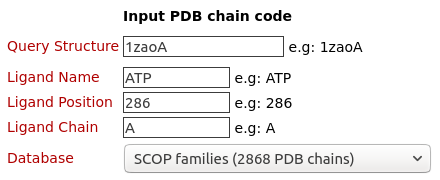
The binding pocket/site of the ligand ATP (Adenosine triphosphate) on the structure of A.fulgidus Rio2 Kinase (PDB code: 1zaoA) is used for structure similarity virtual screening by 3Dclick on the database of SCOP families of 2868 PDB chains.
Please click here to look at the output of this query example.
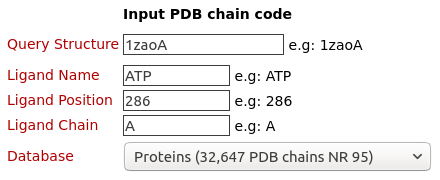
The binding pocket/site of the ligand ATP (Adenosine triphosphate) on the structure of A.fulgidus Rio2 Kinase (PDB code: 1zaoA) is used for structure similarity virtual screening by 3Dclick on the database of Protein (32,647 PDB chains NR 95).
Please click here to look at the output of this query example.
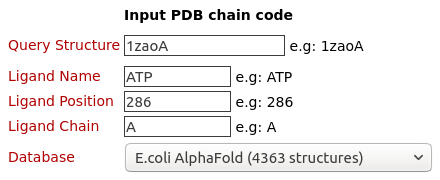
The binding pocket/site of the ligand ATP (Adenosine triphosphate) on the structure of A.fulgidus Rio2 Kinase (PDB code: 1zaoA) is used for structure similarity virtual screening by 3Dclick on the database of E.coli AlphaFold (4363 structures).
Please click here to look at the output of this query example.
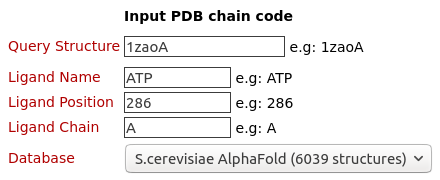
The binding pocket/site of the ligand ATP (Adenosine triphosphate) on the structure of A.fulgidus Rio2 Kinase (PDB code: 1zaoA) is used for structure similarity virtual screening by 3Dclick on the database of S.cerevisiae AlphaFold (6039 structures).
Please click here to look at the output of this query example.
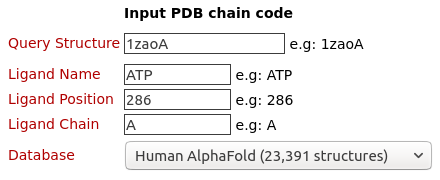
The binding pocket/site of the ligand ATP (Adenosine triphosphate) on the structure of A.fulgidus Rio2 Kinase (PDB code: 1zaoA) is used for structure similarity virtual screening by 3Dclick on the database of Human AlphaFold (23,391 structures).
Please click here to look at the output of this query example.
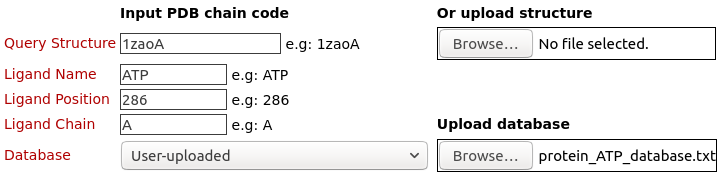
The binding pocket/site of the ligand ATP (Adenosine triphosphate) on the structure of A.fulgidus Rio2 Kinase (PDB code: 1zaoA) is used for structure similarity virtual screening by 3Dclick on the uploaded database of "protein_ATP_database.txt". Click here to download this uploaded database.
Please click here to look at the output of this query example.
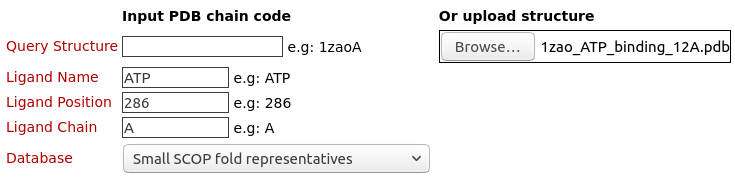
The binding pocket/site of the ligand ATP (Adenosine triphosphate) on the structure of A.fulgidus Rio2 Kinase (PDB code: 1zaoA) is uploaded and used for structure similarity virtual screening by 3Dclick on the database of Small SCOP fold representatives of 252 protein chains. Click here to download this uploaded query structure file.
Please click here to look at the output of this query example.
2. Scores of 3DclickStructure OverlapRoot Mean Square Deviation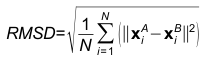
Where, N is the match size, and xiA and xiB are the Cartesian coordinates of representative Cβ atoms of structurally equivalent amino acid residues of proteins A and B. Z-score
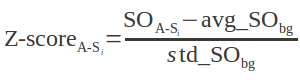
Where Identical ResiduesGood Contacts
Bad ContactsUgly ContactsResidues of TargetGood Contacts after MinimizationBad Contacts after MinimizationUgly Contacts after MinimizationEnergy before MinimizationEnergy after Minimization3. Output of 3DclickThe list of possible target proteins/hits for the query ligand before energy minimization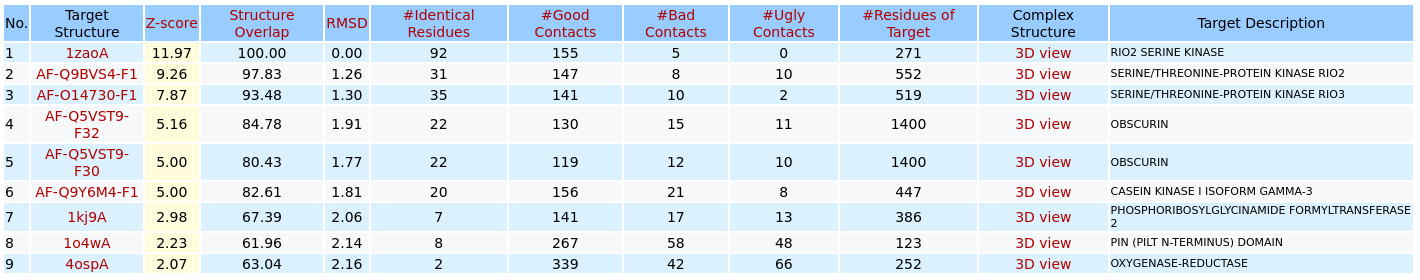
3Dclick displays the output table of 3D structure similarity virtual screening for the binding pocket/site of the ligand ATP (Adenosine triphosphate) from the structure of A.fulgidus Rio2 Kinase (PDB code: 1zaoA) on the uploaded database (as shown in the Example 7). The target proteins are rank ordered by Z-score. Here, 3Dclick identifies the list of possible target proteins with significant Z-scores (Z-score ≥2). In this example, there are nine possible target proteins with Z-score ≥2 from PDB (Protein Data Bank) and AlphaFold structures at EBI (https://alphafold.ebi.ac.uk/). The summary of target protein is shown when users click on each Target Structure in the output table. For each of these possible target protein, 3Dclick also identifies Structure Overlap, RMSD, Number of Identical Residues, Number of Residues of Target Protein, as well as Number of Good Contacts, Number of Bad Contacts, and Number of Ugly Contacts between the ligand and the target protein in their complex. For each of target protein, 3Dclick constructs the complex model with the ligand in its new putative binding site. In addition, 3Dclick displays the visualization of 3D structures for each complex using NGL (https://nglviewer.org/) when users click on each "3D view" of Complex Structure in the output table.
Visualization of the complex structure of ligand and possible target protein before energy minimization
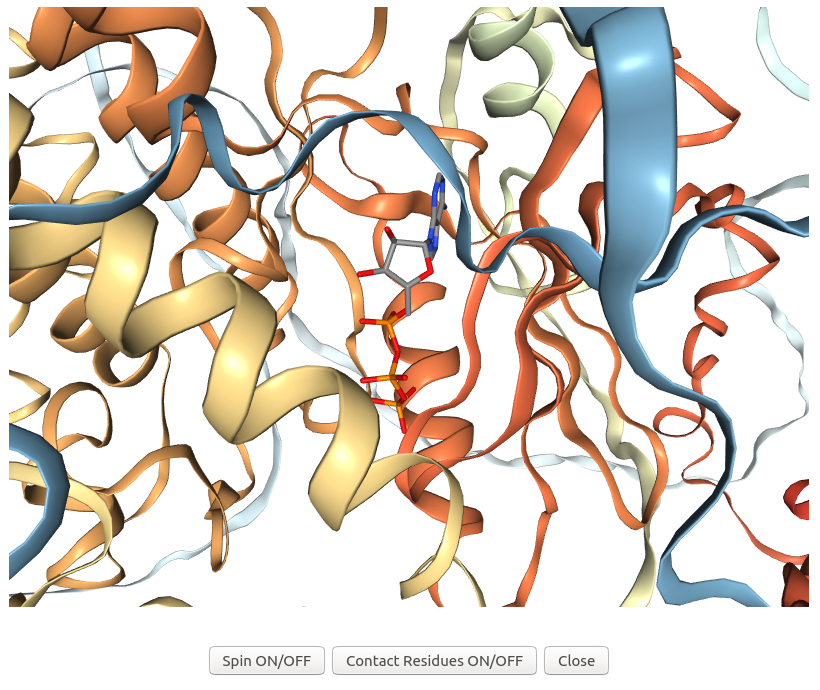
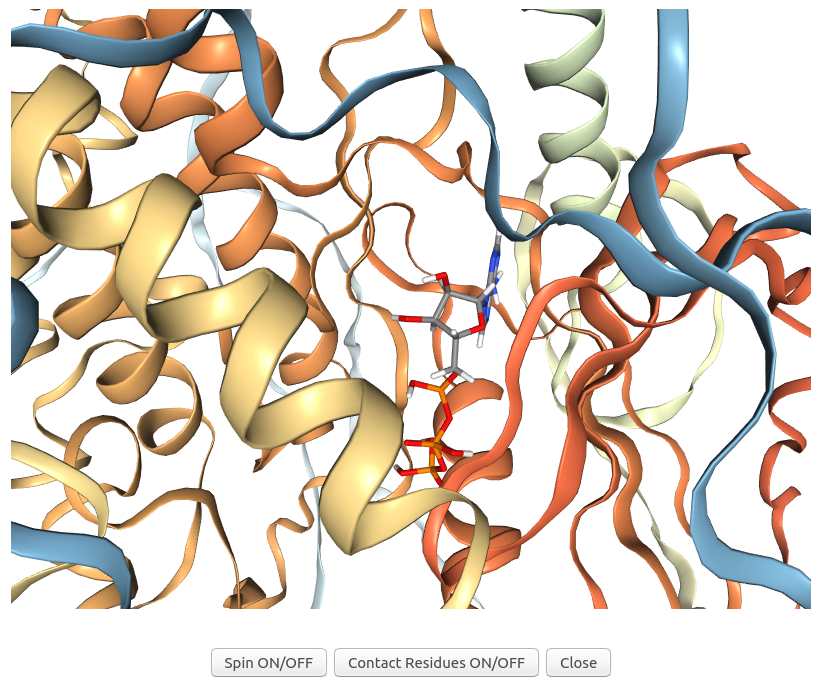
3Dclick displays the visualization of 3D structures for the complex of ligand ATP and possible target protein of human AlphaFold structure of Obscurin (AF-Q5VST9-F32 with 1400 residues) using NGL (https://nglviewer.org/) when users click on "3D view" of the possible target AF-Q5VST9-F32 in the output table of Example 7. As shown in the output table, the human AlphaFold structure of Obscurin (AF-Q5VST9-F32) is identified as the target protein of ATP that has similarity scores with the ATP binding site of A.fulgidus Rio2 Kinase (Z-score = 5.16; Structure Overlap = 84.78%; RMSD = 1.91 Å). In this visualization, the ligand ATP is shown in sticks while the target protein of human AlphaFold structure of Obscurin is shown in ribbons.
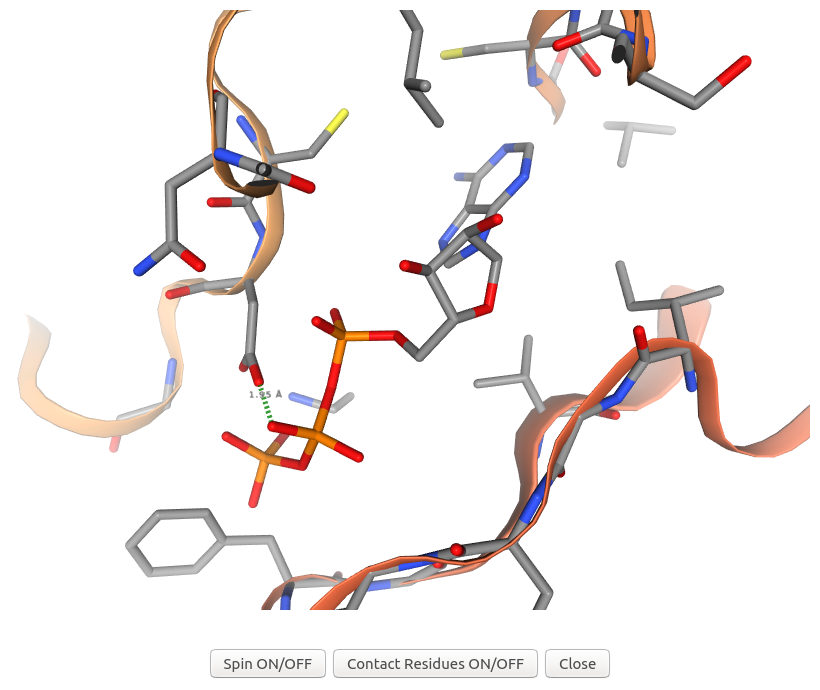
3Dclick displays the visualization of 3D structures for the complex of ligand ATP and possible target protein of human AlphaFold structure of Obscurin (AF-Q5VST9-F32 with 1400 residues) and their contact residues (within 5 Å) using NGL (https://nglviewer.org/) when users click on "Contact Residues ON/OFF" button of the visualization of AF-Q5VST9-F32 in the output table of Example 7. As shown in the output table, the complex of ligand ATP and target protein of human AlphaFold structure of Obscurin (AF-Q5VST9-F32) has the number of Good Contacts = 130, the number of Bad Contacts = 15, and the number of Ugly Contacts = 11 before energy minimization. In this visualization, 3Dclick shows an ugly contact between O1B atom of ATP and OD2 atom of ASP407 of human AlphaFold structure of Obscurin (AF-Q5VST9-F32) with the distance = 1.95 Å and Contact score = 0.66 before energy minimization.
The list of possible target proteins/hits for the query ligand after energy minimization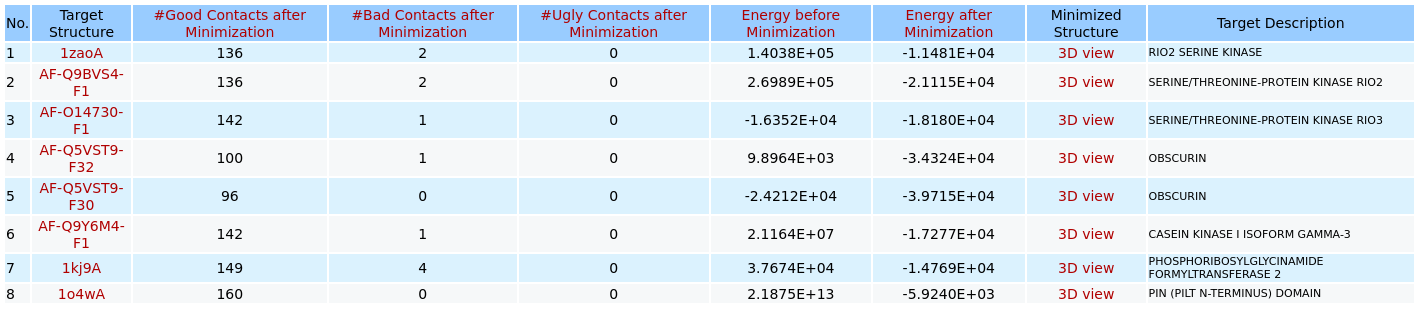
When users click on the link of "Energy minimization step for the top hits and ligand" of the output page of 3D structure similarity virtual screening for the binding pocket/site of the ligand ATP from the structure of A.fulgidus Rio2 Kinase (PDB code: 1zaoA) on the uploaded database (as shown in the Example 7), 3Dclick displays the output table of possible target proteins that have been successfully completed the energy minimization step and have Number of Ugly Contacts = 0. In this example, after the energy minimization step there are eight possible target proteins with their Number of Ugly Contacts = 0 from PDB (Protein Data Bank) and AlphaFold structures at EBI (https://alphafold.ebi.ac.uk/). Compared to the output table before energy minimization, there is only one target protein of Oxygenase-reductase (PDB code: 4ospA with Number of Ugly Contacts before Minimization = 66) that has not been completed the energy minimization step. The summary of target protein is shown when users click on each Target Structure in the output table. For each of these possible target protein, 3Dclick also identifies Number of Good Contacts after Minimization, Number of Bad Contacts after Minimization, and Number of Ugly Contacts after Minimization as well as Energy before Minimization and Energy after Minimization between the ligand and the target protein in their complex after the energy minimization. In addition, 3Dclick displays the visualization of 3D structures for each complex after energy minimization using NGL (https://nglviewer.org/) when users click on each "3D view" of Complex Structure in the output table.
Visualization of the complex structure of ligand and possible target protein after energy minimization
When users click on "3D view" of the possible target AF-Q5VST9-F32 in the output table after the energy minimization step of Example 7, 3Dclick displays the visualization of 3D structures for the complex of ligand ATP and possible target protein of human AlphaFold structure of Obscurin (AF-Q5VST9-F32 with 1400 residues) after energy minimization using NGL (https://nglviewer.org/). In this visualization, the ligand ATP is shown in sticks while the target protein of human AlphaFold structure of Obscurin is shown in ribbons.
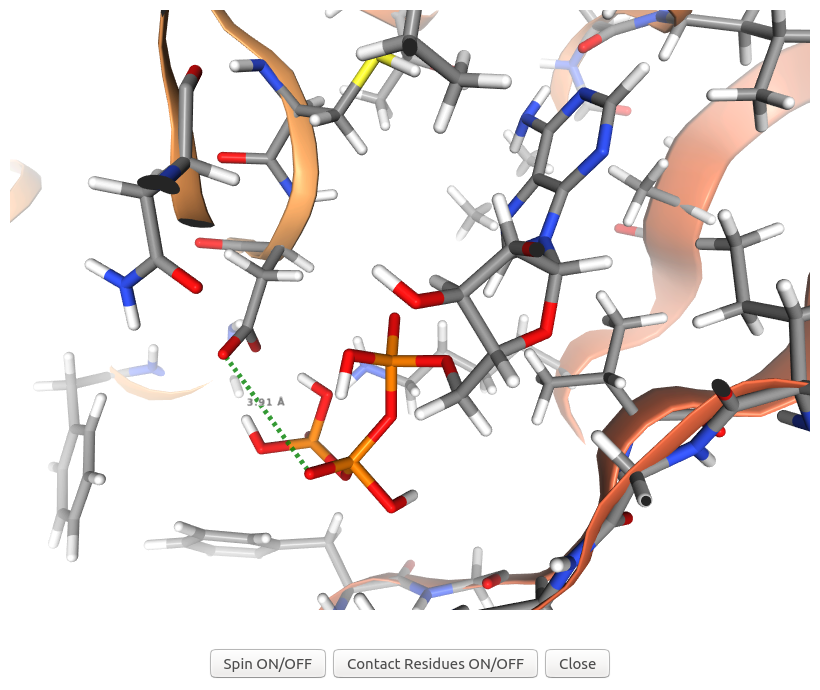
When users click on "Contact Residues ON/OFF" button of the visualization of AF-Q5VST9-F32 in the output table after energy minimization of Example 7, 3Dclick displays the visualization of 3D structures for the complex of ligand ATP and possible target protein of human AlphaFold structure of Obscurin (AF-Q5VST9-F32 with 1400 residues) and their contact residues (within 5 Å) after energy minimization using NGL (https://nglviewer.org/). As shown in the output table after energy minimization, the complex of ligand ATP and target protein of human AlphaFold structure of Obscurin (AF-Q5VST9-F32) has the number of Good Contacts after energy minimization = 100, the number of Bad Contacts after energy minimization = 1, and the number of Ugly Contacts after energy minimization = 0 compared to the number of Bad Contacts before energy minimization = 15, and the number of Ugly Contacts before energy minimization = 11. In this visualization, 3Dclick converts an ugly contact between O1B atom of ATP and OD2 atom of ASP407 of human AlphaFold structure of Obscurin (AF-Q5VST9-F32) before energy minimization to a contact with the distance = 3.91 Å and Contact score = 1.32 after energy minimization.
Since the energy minimization step usually takes a long running time (for example, the running time of energy minimization step for the target of human AlphaFold structure of Obscurin (AF-Q5VST9-F32 with 1400 residues) with ATP using the binding site of A.fulgidus Rio2 Kinase is 13 minutes while 3Dclick only took 2 seconds for 3D comparison of these two structures), our 3Dclick web server currently shortlists the top 100 hits/target proteins of significant Z-score (Z-score ≥2) and uses them for the energy minimization step. Please connect with us, if users would like to have larger possible target proteins for their ligands/small molecules or drugs.
4. Mouse controls for 3Dclick visualizationDisplaying atom name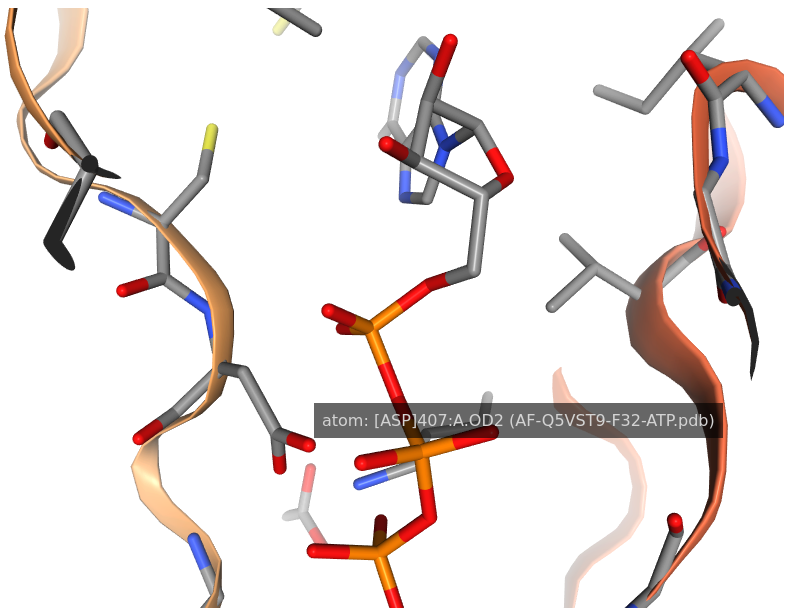
By moving the mouse pointer over any atom in the visualization window of 3Dclick, the corresponding atom name is shown. As seen in the above figure, the name of sidechain atom OD2 of ASP407 of human AlphaFold structure of Obscurin (AF-Q5VST9-F32) is displayed.
Measuring distance between two atoms
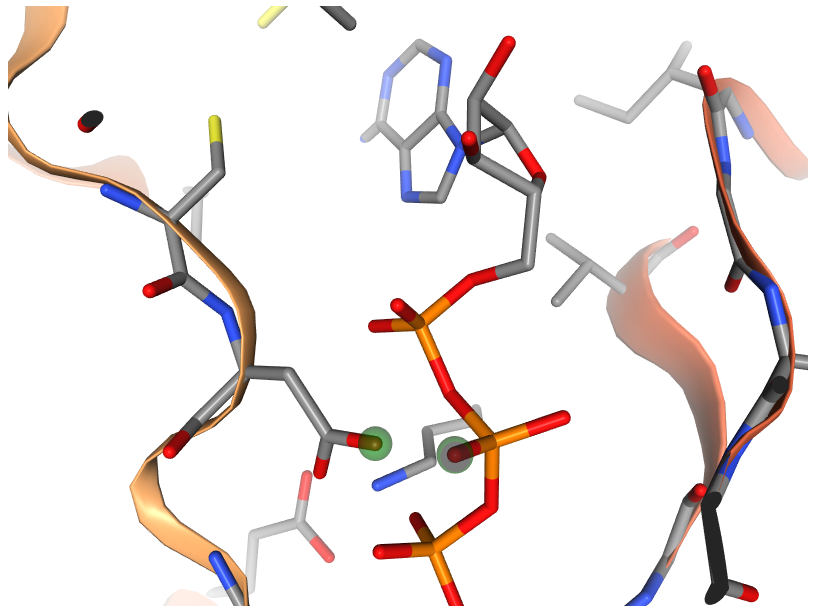

After selecting the two atoms, in order to measure the distance between two atoms, please Right click again on the second selected atom. The green dashed line between the two atoms along with their distance in Å are shown. As displayed in the above figure, the distance between O1B atom of ATP and OD2 atom of ASP407 of human AlphaFold structure of Obscurin (AF-Q5VST9-F32) is 1.95 Å.
Moving, rotating and zoom in/out the complex structure of ligand and target protein
To move, rotate, and zoom in/out the complex structure of ligand and target protein in the visualization window of 3Dclick, please use the following mouse button: 5. Running timeThe running time increases with increase in:
Below table lists running times of the query ligand ATP (Adenosine triphosphate) at the position of 286 chain A from the structure of A.fulgidus Rio2 Kinase with ATP (PDB code: 1zaoA chain A) using different databases. Note that these are estimated running times. Jobs may also queue up on the server.
6. Browser compatibility
|