3D binding pocket protein structure similarity virtual screening
|
 |
|
|
|
|
|
|
|
|
|
|
|
|
Examples
2. Possible target proteins of anti-cancer drug Lapatinib 1. Query structure of A.fulgidus Rio2 Kinase with ligand ATP and possible targets of ATP
Please click here to look at the output of this query example.
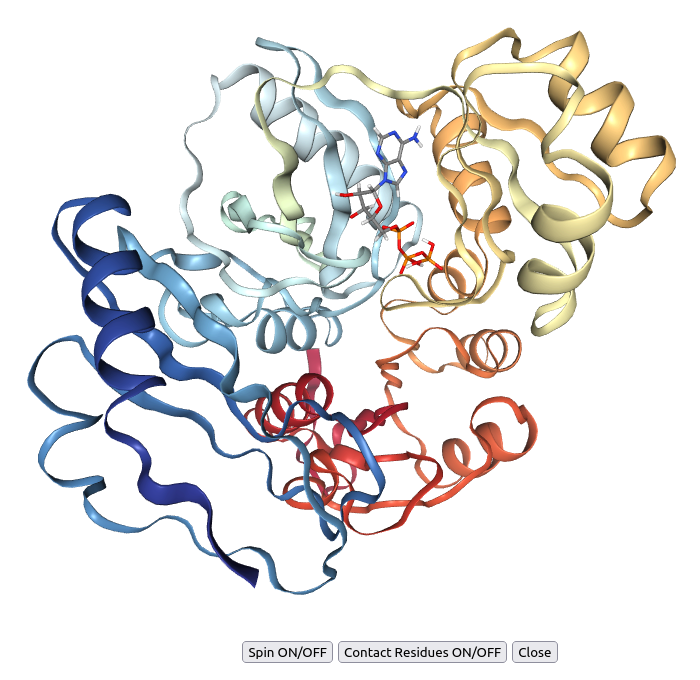
Figure 1: 3Dclick displays the visualization of 3D structures for the complex of PurT-encoded glycinamide ribonucleotide transformylase (PDB code: 1kj9A) and ATP using NGL (https://nglviewer.org/). The detailed visualization is shown when users click on "3D view" of the possible target 1kj9A (rank 9th) in the output table after the energy minimization step on our 3Dclick server.
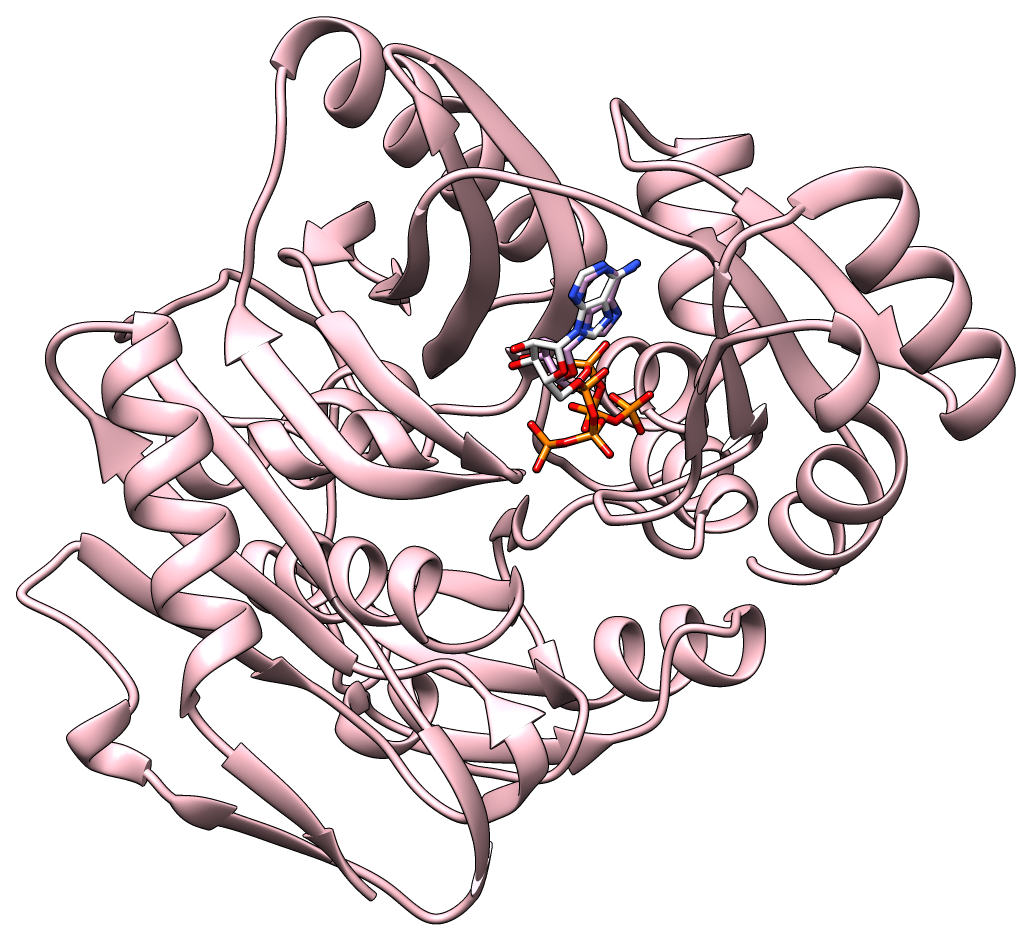
Figure 2: The ATP in X-ray structure of PurT-encoded glycinamide ribonucleotide transformylase (white and orange sticks) has the same location in 3D structure as ATP predicted by 3Dclick (plum and orange sticks).
2. Possible target proteins of anti-cancer drug Lapatinib
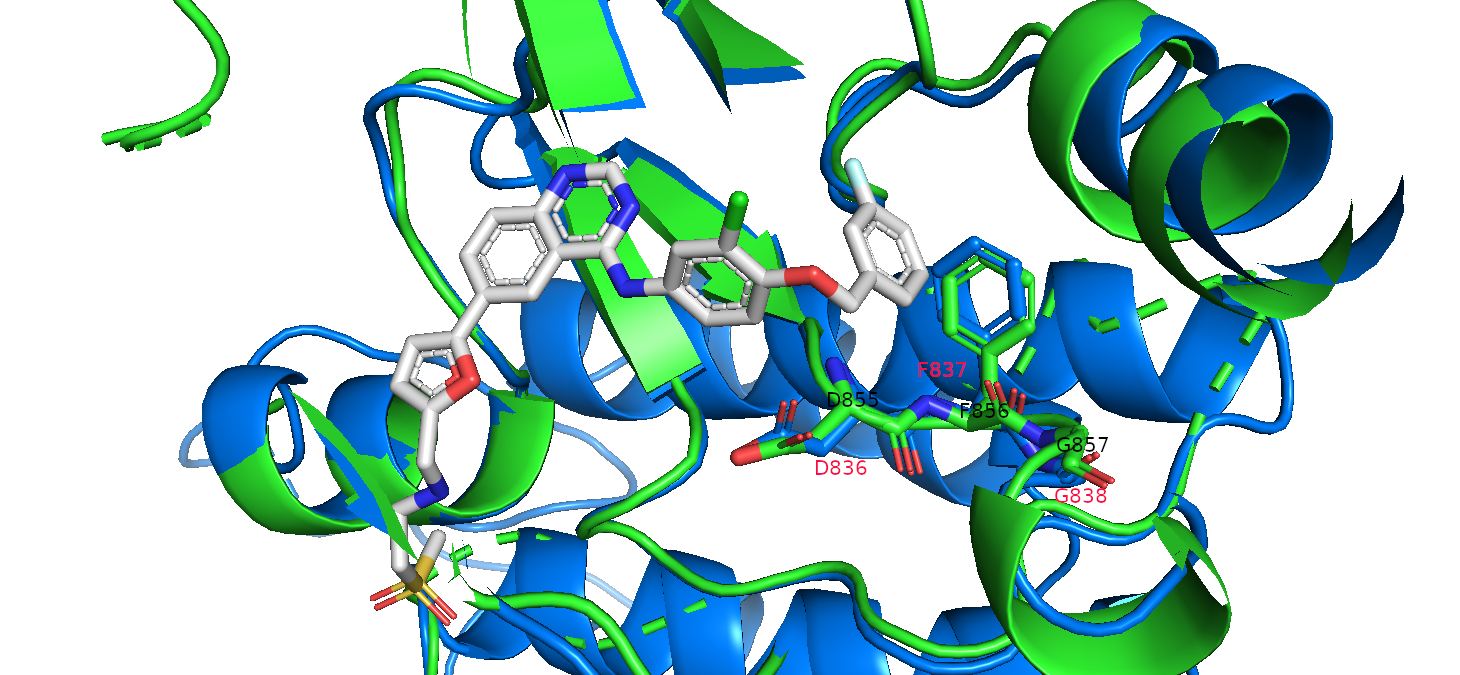
Figure 3: 3Dclick superimposition of the receptor tyrosine-protein kinase (ERBB-4) (blue ribbons) (PDB code: 3bbtB, Qiu et al., Structure, 2008 , rank 20th in the output table after the energy minimization step) on the binding pocket of epidermal growth factor receptor (EGFR) (green ribbons) (PDB code: 1xkkA) with the drug Lapatinib (gray sticks) using Pymol (https://pymol.org). The DFG (D836, F837, G838) motif of the activation loop of ERBB-4 (red label) occupies the same location in the 3D structures with the DFG (D855, F856, G857) motif of EGFR (black label).
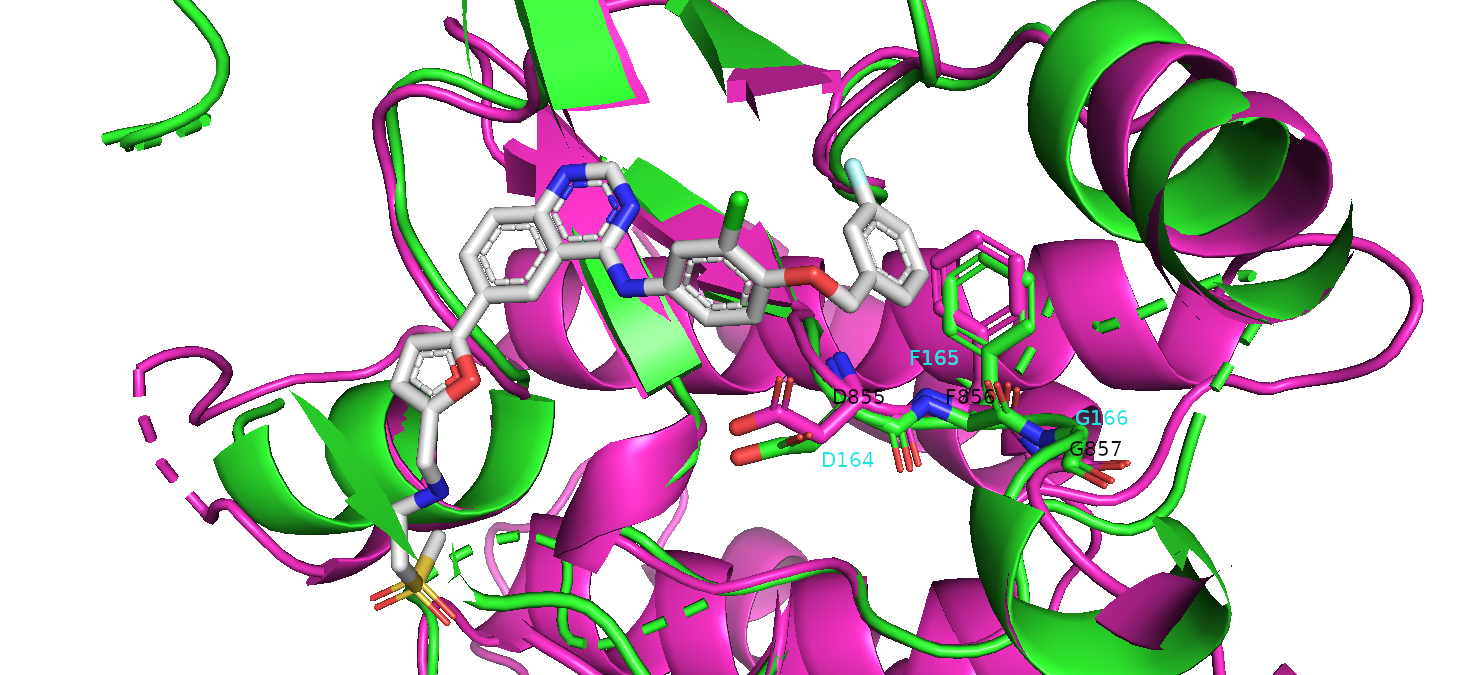
Figure 4: 3Dclick superimposition of the receptor-interacting serine/threonine-protein kinase 2 (RIPK2) (magenta ribbons) (PDB code: 5ng3A, Pellegrini et al., PLoS One, 2017 , rank 35th in the output table after the energy minimization step) on the binding pocket of epidermal growth factor receptor (EGFR) (green ribbons) (PDB code: 1xkkA) with the drug Lapatinib (gray sticks). The DFG (D164, F165, G166) motif of the activation loop of ERBB-4 (cyan label) occupies the same location in the 3D structures with the DFG (D855, F856, G857) motif of EGFR (black label).
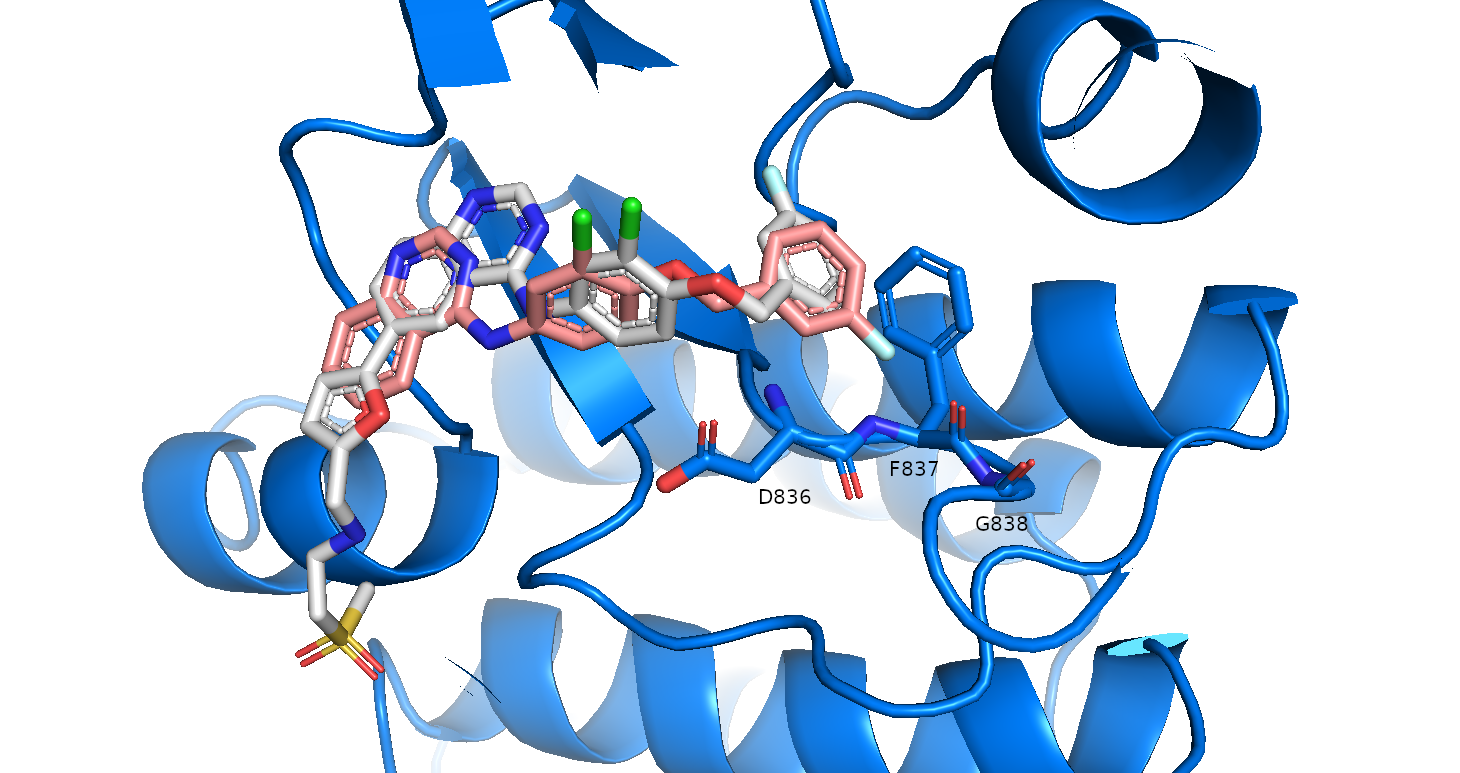
Figure 5: The Lipatinib in X-ray structure of ERBB-4 kinase (pink sticks) has the same location in 3D structure as Lipatinib predicted by 3Dclick (gray sticks) as well as both their CL atoms overlap and point the same direction. The DFG (D836, F837, G838) is the motif of activation loop of ERBB-4 (black label) on the binding pocket with Lipatinib.
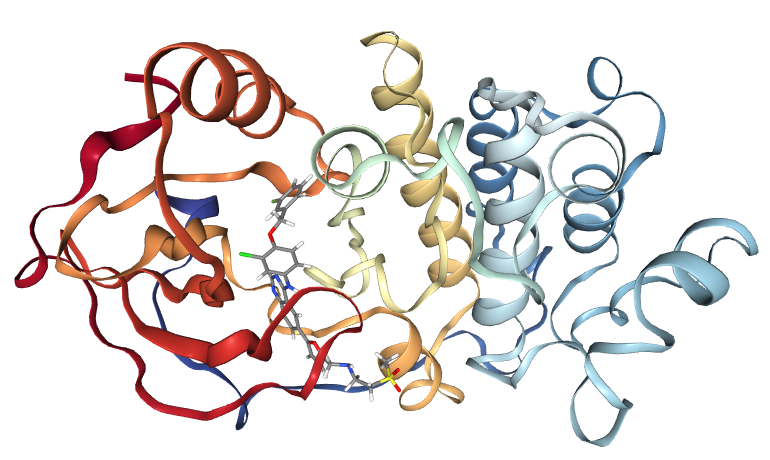
Figure 6: 3Dclick displays the visualization of 3D structure for the complex of epidermal growth factor receptor (EGFR) (PDB code: 2rgpA) and Lipatinib using NGL (https://nglviewer.org/). The detailed visualization is shown when users click on "3D view" of the possible target 2rgpA (rank 2nd) in the output table after the energy minimization step on our 3Dclick server. The binding result (dissociation constant Kd) of EGFR and Lipatinib is 2.4 nM (Davis et al., Nature Biotechnology, 2011).
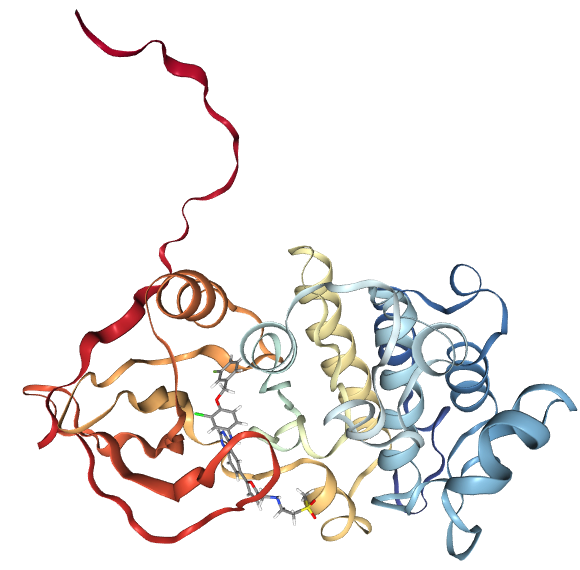
Figure 7: 3Dclick displays the visualization of 3D structure for the complex of receptor tyrosine-protein kinase (ERBB-4) (PDB code: 2r4bA) and Lipatinib using NGL (https://nglviewer.org/). The detailed visualization is shown when users click on "3D view" of the possible target 2r4bA (rank 19th) in the output table after the energy minimization step on our 3Dclick server. The binding result (dissociation constant Kd) of ERBB-4 and Lipatinib is 54 nM (Davis et al., Nature Biotechnology, 2011).
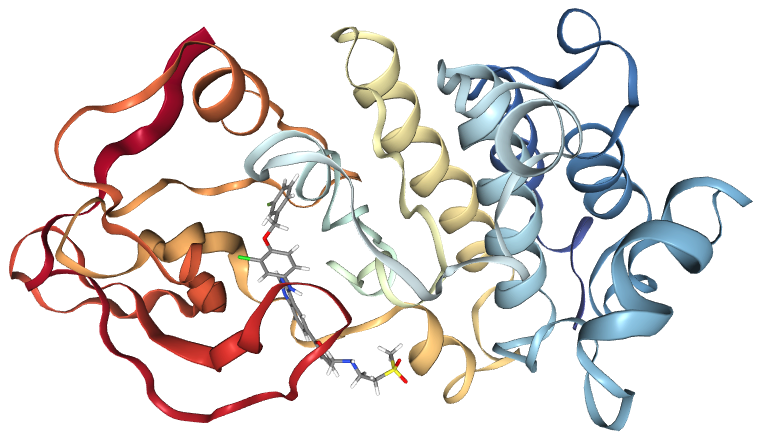
Figure 8: 3Dclick displays the visualization of 3D structure for the complex of receptor tyrosine-protein kinase (ERBB-3) (PDB code: 3lmgA) and Lipatinib using NGL (https://nglviewer.org/). The detailed visualization is shown when users click on "3D view" of the possible target 3lmgA (rank 24th) in the output table after the energy minimization step on our 3Dclick server. The binding result (dissociation constant Kd) of ERBB-3 and Lipatinib is 5500 nM (Davis et al., Nature Biotechnology, 2011).
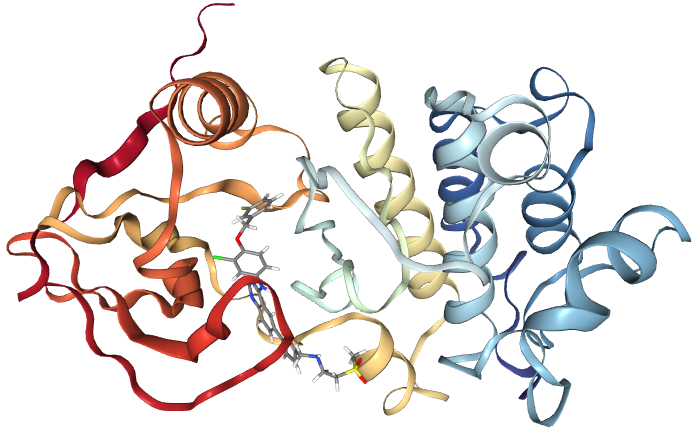
Figure 9: 3Dclick displays the visualization of 3D structure for the complex of receptor tyrosine-protein kinase (ERBB-2) (PDB code: 7jxhA) and Lipatinib using NGL (https://nglviewer.org/). The detailed visualization is shown when users click on "3D view" of the possible target 3lmgA (rank 26th) in the output table after the energy minimization step on our 3Dclick server. The binding result (dissociation constant Kd) of ERBB-2 and Lipatinib is 7 nM (Davis et al., Nature Biotechnology, 2011).
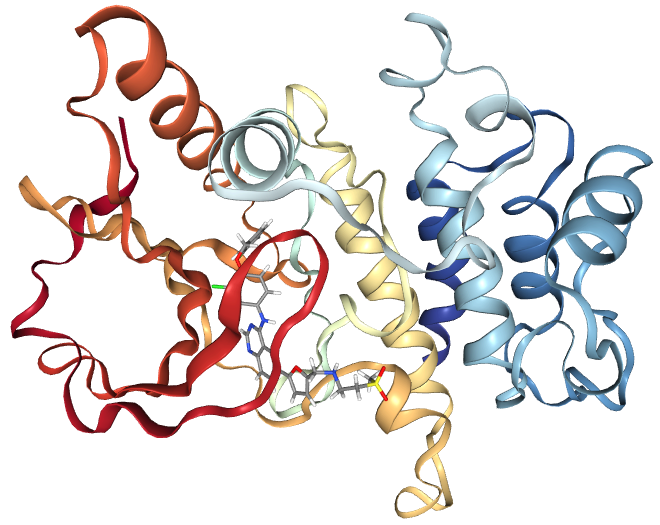
Figure 10: 3Dclick displays the visualization of 3D structures for the complex of receptor-interacting serine/threonine-protein kinase 2 (RIPK2) (PDB code: 5ng3A) and Lipatinib using NGL (https://nglviewer.org/). The detailed visualization is shown when users click on "3D view" of the possible target 5ng3A (rank 35th) in the output table after the energy minimization step on our 3Dclick server. The binding result (dissociation constant Kd) of RIPK2 and Lipatinib is 3600 nM (Davis et al., Nature Biotechnology, 2011).
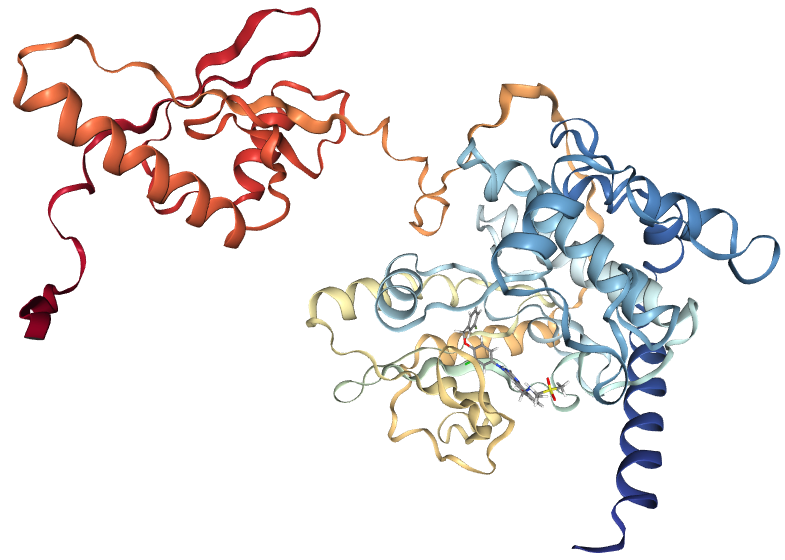
Figure 11: 3Dclick displays the visualization of 3D structure for the complex of dual specificity mitogen-activated protein kinase kinase 5 (MEK5) (AlphaFold structure: AF-Q13163-F1) and Lipatinib using NGL (https://nglviewer.org/). The detailed visualization is shown when users click on "3D view" of the possible target AF-Q13163-F1 (rank 36th) in the output table after the energy minimization step on our 3Dclick server. The binding result (dissociation constant Kd) of MEK5 and Lipatinib is 1100 nM (Davis et al., Nature Biotechnology, 2011).
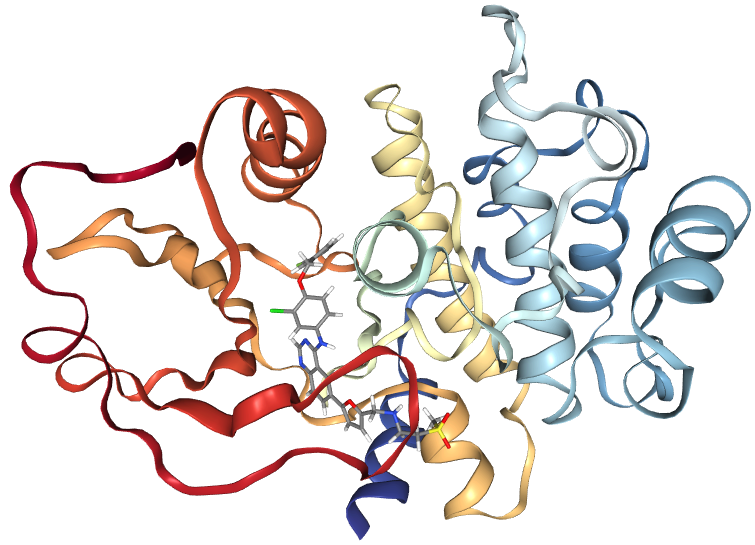
Figure 12: 3Dclick displays the visualization of 3D structures for the complex of serine/threonine-protein kinase 10 (LOK) (PDB code: 5ajqA) and Lipatinib using NGL (https://nglviewer.org/). The detailed visualization is shown when users click on "3D view" of the possible target 5ajqA (rank 51th) in the output table after the energy minimization step on our 3Dclick server. The binding result (dissociation constant Kd) of LOK and Lipatinib is 4400 nM (Davis et al., Nature Biotechnology, 2011).
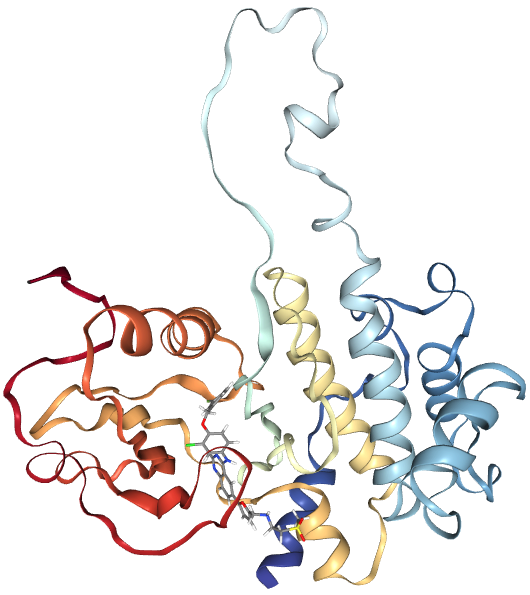
Figure 13: 3Dclick displays the visualization of 3D structures for the complex of STE20-like serine/threonine-protein kinase (SLK) (PDB code: 6hvdA) and Lipatinib using NGL (https://nglviewer.org/). The detailed visualization is shown when users click on "3D view" of the possible target 6hvdA (rank 55th) in the output table after the energy minimization step on our 3Dclick server. The binding result (dissociation constant Kd) of SLK and Lipatinib is 3300 nM (Davis et al., Nature Biotechnology, 2011).
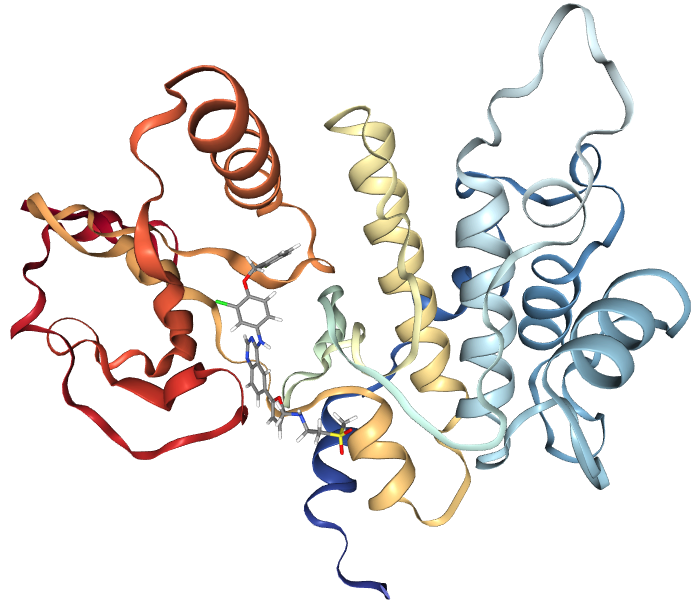
Figure 14: 3Dclick displays the visualization of 3D structures for the complex of dual specificity mitogen-activated protein kinase kinase 7 (MKK7) (PDB code: 6yg6A) and Lipatinib using NGL (https://nglviewer.org/). The detailed visualization is shown when users click on "3D view" of the possible target 6yg6A (rank 70th) in the output table after the energy minimization step on our 3Dclick server. The binding result (dissociation constant Kd) of MKK7 and Lipatinib is 4400 nM (Davis et al., Nature Biotechnology, 2011).
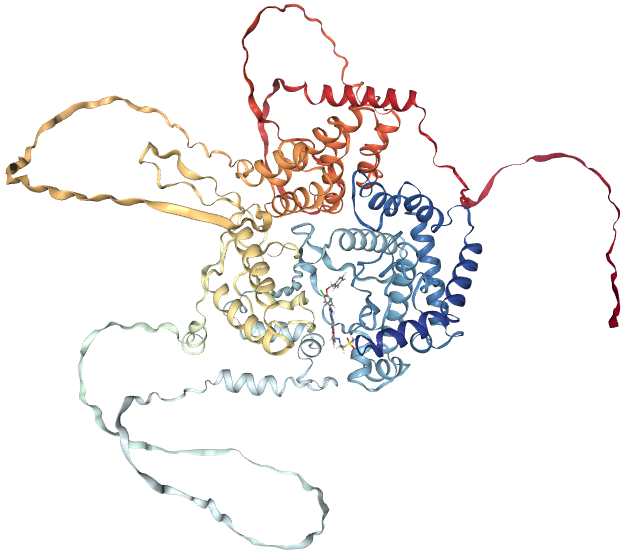
Figure 15: 3Dclick displays the visualization of 3D structure for the complex of phosphatidylinositol 4-kinase beta (PIK4CB) (AlphaFold structure: AF-Q9UBF8-F1) and Lipatinib using NGL (https://nglviewer.org/). The detailed visualization is shown when users click on "3D view" of the possible target AF-Q9UBF8-F1 (rank 76th) in the output table after the energy minimization step on our 3Dclick server. The binding result (dissociation constant Kd) of PIK4CB and Lipatinib is 940 nM (Davis et al., Nature Biotechnology, 2011).
Figure 16: The possible complex of phosphatidylinositol 4-phosphate 3-kinase C2 domain-containing subunit beta (PIK3C2B) (AlphaFold structure: AF-O00750-F1, blue ribbons) and Lipatinib (gray sticks) using 3Dclick before filtering by the number of ugly contacts.
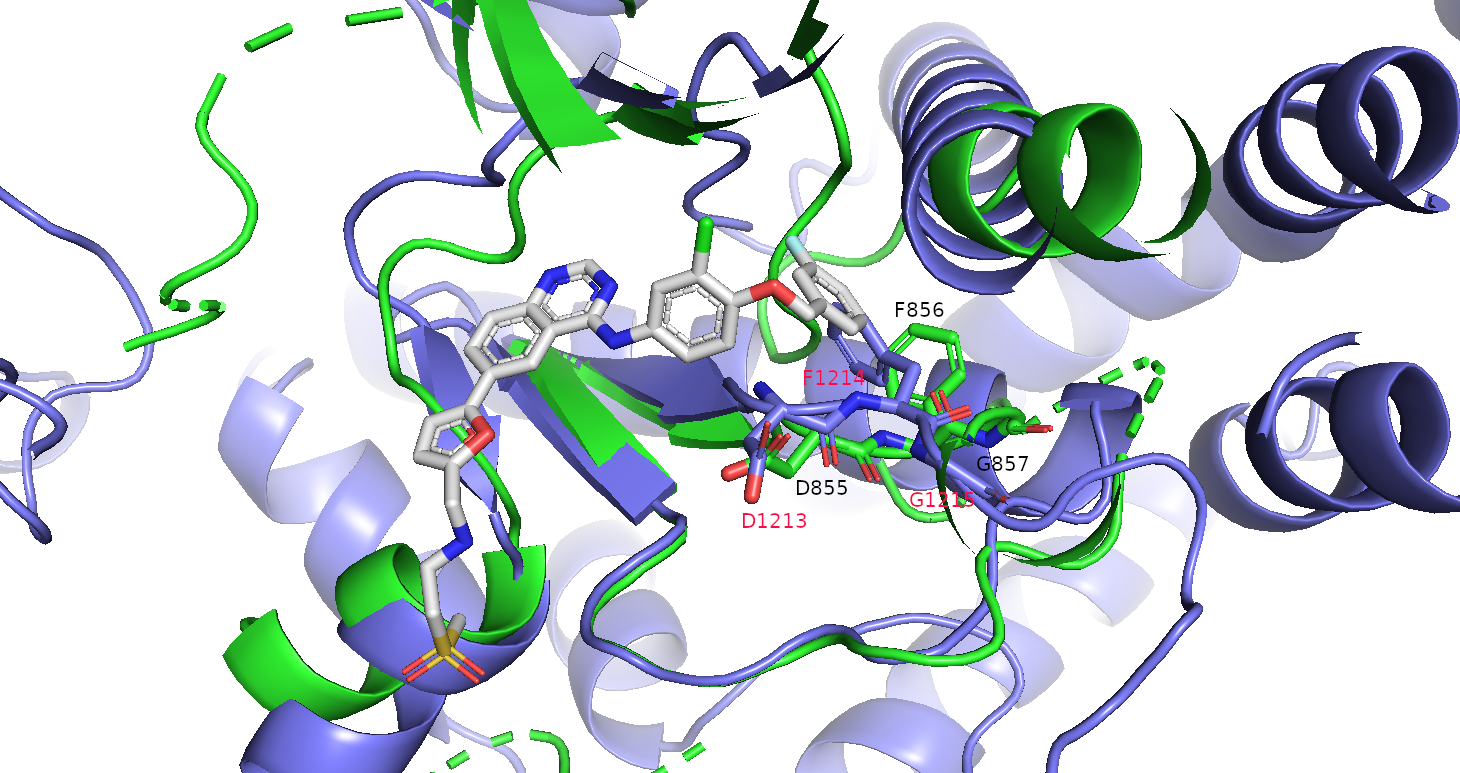
Figure 17: 3Dclick superimposition of phosphatidylinositol 4-phosphate 3-kinase C2 domain-containing subunit beta (PIK3C2B) (blue ribbons) (PDB code: AF-O00750-F1) on the binding pocket of epidermal growth factor receptor (EGFR) (green ribbons) (PDB code: 1xkkA) with the drug Lapatinib (gray sticks). The DFG (D1213, F1214, G1215) motif of the activation loop of PIK3C2B (red label) occupies the same location in the 3D structures with the DFG (D855, F856, G857) motif of EGFR (black label). This supperimposed result suggests that 3Dclick identifies the correct binding pocket of PIK3C2B with Lapatinib.
|